

Bank of America (BAC) & J.P. Morgan (JPM) – Big Bank Earnings – January 13, 2024
The theme of the bank earnings I covered was a resilient consumer and economy. Both are modestly slowing and showing signs of more fragility, but both remain healthy.
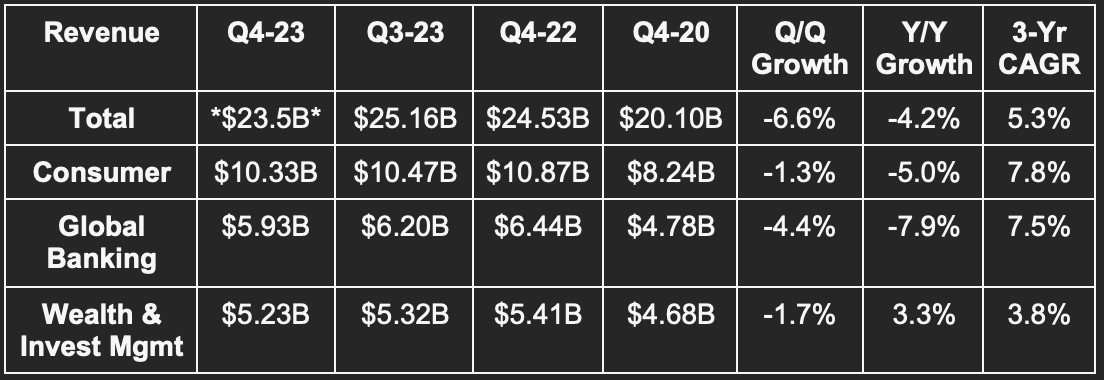
Bank of America
“We ended 2023 with our economists projecting the Fed has successfully steered the U.S. economy to a soft landing. In regards to the economy, during 2023, we consistently made a few points regarding what we were seeing in our customer data here at Bank of America. First, the year-over-year growth rate and spending from the beginning of ’23 started declining. And it went from 9% in early 2023 to 10% growth rate to this quarter’s 4% to 5% growth rate. That’s where it stands here early in 2024.” – Bank of America CEO Brian Moynihan
“Consumer balance sheets are generally in good shape and while impacted by higher rates.” – Bank of America CEO Brian Moynihan
Results:
- Missed revenue estimate by 7% or missed by 0.9% *ex-special charges.*
- Missed $0.58 GAAP EPS estimate by $0.23; beat by $0.12 *ex-special charges.*
- Missed ROA & ROE estimates. ROA was 0.93% for 2023 vs. 0.88% Y/Y ex-FDIC. ROTCE was 15% vs. 15.1% Y/Y ex-FDIC.
- Roughly met net interest income guidance.
Source: Brad Freeman – SEC Filings, Company Presentations, and Company Press Releases

Source: Brad Freeman – SEC Filings, Company Presentations, and Company Press Releases
ROTCE = Return on tangible common equity; NIM = net interest margin; CET1 = common equity tier 1 ratio.
Notes on the tables:
- Revenue and net income were impacted by a Bloomberg Short Term Bank Yield (BSBY) index cessation impact and an FDIC special charge (like for JPM). The FDIC item was to replenish federal insurance reserves. BSBY was based on not receiving the traction needed to justify continuing to offer it.
- Net interest income fell 5% Y/Y.
Balance Sheet:
- $897 billion in global liquidity; $302 billion in long term debt.
- $33.34 book value per share vs. $30.61 Y/Y.
- Loans & leases rose 1.1% Y/Y.
- Deposits fell slightly Y/Y.
- $1.1 billion in credit loss provisions vs. $1.2 billion Q/Q and $1.1 billion Y/Y.
Important Notes:
Consumer Banking:
- 0.59% non-performing loan (NPL) rate on consumer loans vs. 0.61% Q/Q & 0.60% Y/Y.
- 1.30% consumer net charge off rate vs. 1.16% Q/Q & 0.78% Y/Y.
- Total consumer spending in 2023 reached $4.1 trillion vs. $4.0 trillion Y/Y. Consumer spending on BofA’s platform has compounded at a 10% clip since 2020. Stimulus has helped a lot. Consumers are spending more on travel and other services. They’re spending less on retail goods and gas, which is partially due to disinflation.
- 7.18% consumer credit card risk-adjusted profit margin vs. 7.70% Q/Q & 9.87% Y/Y.
Commercial Banking:
Commercial real estate is driving this segment’s NPL rate higher. Overall, NPL rate rose to 0.47% vs. 0.35% Q/Q and 0.18% Y/Y. Very tough times for the sector. Still, the overall NPL rate across the portfolio is 0.52% vs. 0.36% pre-pandemic. Again… worsening, but not terrible.

Source: YCharts
JP Morgan
“The U.S. economy continues to be resilient, with consumers still spending, and markets currently expect a soft landing. The economy is being fueled by large amounts of government deficit spending & past stimulus. There is also an ongoing need for increased spending. This may lead inflation to be stickier and rates to be higher than markets expect.” — CEO Jamie Dimon
Results:
- Missed revenue estimate by 2.9% but managed revenue beat by 0.5%.
- Missed $3.41 GAAP EPS estimate by $0.37 but beat by $0.37 ex-FDIC.
- Missed return on equity (ROE) & return on asset (ROA) estimates.

Source: Brad Freeman – SEC Filings, Company Presentations, and Company Press Releases

Source: Brad Freeman – SEC Filings, Company Presentations, and Company Press Releases
Notes on the tables:
- Q4 2023 net income margin excludes a special FDIC charge across the big banking sector. Net income margin was 24.1% without this exclusion.
- Revenue and net interest income growth was 7% and 12% Y/Y respectively when excluding the FRC M&A.
- Loans rose 4% Y/Y ex-FRC and deposits fell 3% Y/Y ex-FRC.
2024 Guidance:
$88B in net interest income vs. $89.2B Y/Y; $90B in expense vs. $85.7B Y/Y; < 3.5% net charge off rate for card service vs. ~2.5% Y/Y.
Balance Sheet:
- $1.4 trillion in cash & marketable securities; $391 billion in long term debt.
- CET1 remains well above its 11.4% regulatory minimum.
- $2.76 billion in credit loss provisions vs. $1.38 billion Q/Q & $2.29 billion Y/Y.
Important Notes:
Its card services net charge off rate of 2.79% compares to 2.49% Q/Q & 1.62% Y/Y. Its commercial net charge off rate of 0.18% compares to 0.08% Q/Q & 0.06% Y/Y. Like for BofA, this is being driven by deterioration in its commercial real estate portfolio.

Source: Brad Freeman proprietary research