
Investing’s Best ‘Factors’
Why did you buy the last stock that you bought?
I don’t know.
But you do.
You had a reason.
Let’s call that reason a factor. In fact, you might have had several factors.
Factors, in academic parlance, are the reasons we buy, hold, or sell investments.
Technically, any reason for buying can be a factor: “hard” reasons like P/E ratios, returns on equity, or sales growth, semi-hard reasons like hotness of industry, policy changes, or cool new upcoming products, or even weird stuff like CEO haircut or changes to an executive’s speaking speed, pitch rate, volume, and use of filler words on conference calls.
Softer factors are hard to analyze and compare, so unsurprisingly, research focuses on standardized quantifiable factors – numbers like return on equity (ROE), sales growth, and P/E ratios.
Investing is Almost 100% About Factors
Over the long run, the factors you choose will determine your investing performance.
Read that again if necessary.
It’s not unlike dating and marrying: if you’re looking for a good heart, kindness, and conscientiousness in a person, you’re probably headed for a more successful relationship than if you’re focused on chest size, alcohol tolerance, and curb appeal.
But it’s not quite as simple as finding the best. Social sciences – investing and dating are social sciences – entail market dynamics.
You want a partner who’s kind-hearted, conscientious and gorgeous or handsome. But guess what? So does everyone else.
Ditto for stocks. A perfect stock (technically, company) would have high profit margins, rapacious sales growth, a protective “moat” keeping competitors at bay… and a cheap valuation.
This stock does not exist.
Investing, like courtship, is as much about the factors that you insist on as it is about the factors you’re willing to give up. And, as you’ll see later in this piece, about the combinations of factors you choose.
In one case, $10,000 would have grown to almost $70 million with one set of factors, versus just a bit over $100,000 with another, over the same time period.
Because investing is a social science, and because people change, the performance of factors changes, too.
Even Warren Buffett Changed His Factors
Ben Graham, Warren Buffett’s mentor, made a small fortune buying “net net” companies trading below their cash value (technically, net current asset value).
While it lasted, the net-net era provided Buffett’s best returns. But as equity markets matured, the obvious bargains disappeared, forcing Buffett to evolve from net-net investor in the 1950s to just regular value investor in the 1960s.
(NB: Net-net investing still has die-hard adherents, who cite evidence that Graham’s net-net strategy remained profitable for longer than conventional wisdom holds, though there’s also evidence that net-net studies suffer from an inflated-return bias.)
Buffett changed again in 1972, when Charlie Munger persuaded him to buy See’s Candies, “the first high-quality business Buffett bought” in Munger’s words. For a guy who used to wash his car in the rain to save money, paying higher valuations for quality must have been a tough swallow, but it worked.

In factor-speak – and I’m simplifying here – Buffett has evolved from buying companies whose net current assets exceed their market capitalizations to companies with low P/E ratios to companies with “quality” characteristics. (There’s no set definition of “quality,” but it might entail things like higher and more consistent profit margins, high returns on equity and invested capital (ROE and ROIC), a higher ratio of cash flow to accrual income, non-declining revenue and earnings, high and more qualitatively, long-term management with skin in the game.)
And Buffett himself has become a factor: If you’ve seen the 45,000 attendees at Berkshire Hathaway’s annual meeting, you know that scores of copycat investors and probably trillions of US dollars are now seeking “Buffett-y” looking companies, presumably lowering the returns of Buffett-syle investing.
What Factors Work Best in Investing?
This is like asking which cheese is best: it’s impossible to answer.
Even quantifiable factors come in all kinds, from those derived from financial statements to those mixing in market valuations of equity or debt, to those based on stock price behavior like momentum and volatility, to macroeconomic factors like interest rates, inflation, money supply, and credit conditions.
Factors can be combined, too, meaning there’s a near-infinite number of factor permutations.
| James’ Take: The only factors that reliably work over time are those that exploit either a cognitive bias or human psychology element, or a logistical limitation like size or market microstructure, because those are harder to trade away. |
I’ll highlight two areas – size and value/growth — that have shown impressive results.
Small Firm Effect
The Small Firm Effect has long been a thing in academia. For instance, these guys (Lustig and Leinbach, 1983) say that from 1951 to 1979, the smallest 20% of NYSE stocks by market cap had a cumulative abnormal return (return above “expected” return per unit of risk according to conventional finance theory; note, though, that the concept of cumulative abnormal return is questionable to some) of 20.65% versus 1.53% for the largest 20%.
Similarly, note Professor Elroy Dimson of Cambridge University’s chart showing what’s can only be described as massively better performance for small caps in the UK:
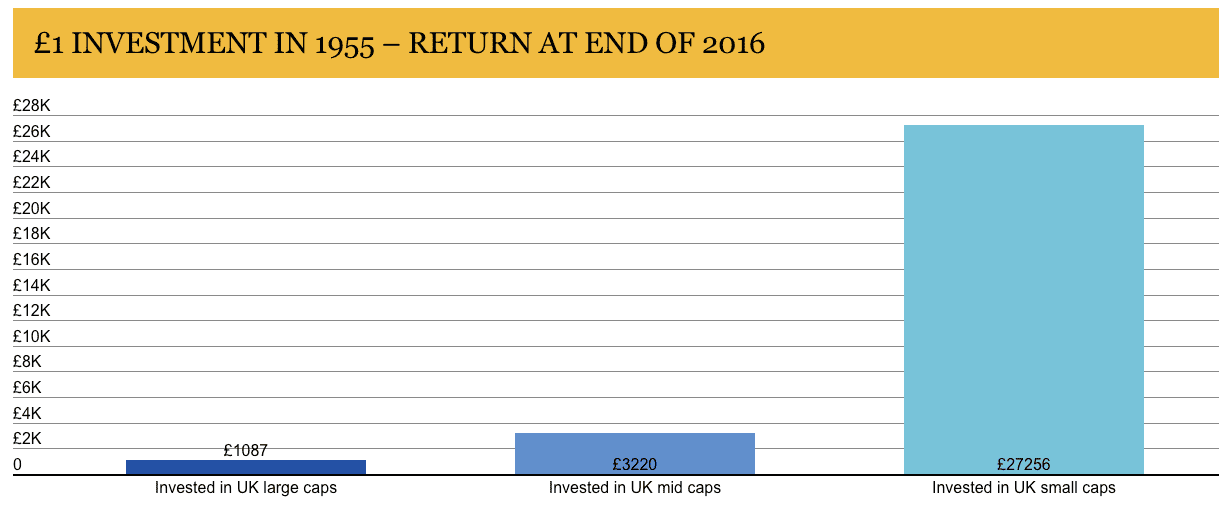
Source: Elroy Dimson, Cambridge Judge Business School
Of course, an immediate question is: Why?
Amongst academics, this has been thoroughly reviewed to the point that the reviews have been reviewed, too, with – you guessed it – no unanimous answer.
On a simple level, we all know that small companies don’t offer enough investment capacity for big, “smart money” investors like Berkshire Hathaway or Bridgewater or Blackstone.
But beyond that, some say it’s because small firms are riskier. Some say it’s not. (Cliff Asness attempts to debunk the small firm debunkers here and in the paper he links to in this article.) Some say that a chunk of the Small Firm Effect benefit comes from microcaps.
Factor Investing: No “Easy” Button
But even microcap performance is contested, in a conundrum that microcosms the conundrum of factors writ large.
Ehren Stanhope of O’Shaughnessy Asset Management, a firm that specializes in factor-based investing, found that one specific group of microcaps returned 20.3% annually from 1982-2016, versus just 12% annually for large cap shares. Impressively, these returns came with just moderately higher volatility than the large caps (19.6% per year vs. 17%).
But I did say “one specific group.”
Stanhope found the following from 1982 to 2016:
- The Russell 1000 Index (the 1000 largest US companies) returned 11.7% annually with 15.1% volatility
- The Russell 2000 Index, containing the 1001st largest company through the 3000th, returned 10.8% annually with 19.1% volatility
- The Russell Microcap Index (which contains the 2000th through the 4000th largest company, and thus overlaps by a thousand with the Russell 2000 Index) returned just 10.1% annually with 20.5% volatility – the greatest risk of the lot for the lowest return.
Microcap investing looks boneheaded from that data: the highest risk and the lowest return. Plus, microcaps are less liquid, meaning it’s often harder to buy as much as you want at the price you want, and ditto for selling.
But Stanhope kept going, sorting microcaps in various ways. I’ll skip his thresholds and definitions for expediency and note that he found that high-quality value microcaps actually trounce large stocks.
| Large stocks | All Microcaps | High-quality Microcaps | High-quality Value Microcaps | |
| Return | 12% | 8.9% | 14.2% | 20.3% |
| Volatility | 17% | 24.5% | 23.8% | 19.6% |
| Sharpe Ratio | 0.41 | 0.16 | 0.39 | 0.78 |
Data source: Ehren Stanhope/O’Shaughnessy Asset Management
Before you dedicate your life to high-quality value microcap investing, note that the time period can matter a lot for factor studies (2023, for instance, was a year of mega-cap domination), and smaller companies tend to do best operationally when interest rates are low and the domestic economy is strong.
Value vs. Growth
Unless you’re shorting against the box or a short seller buying a share or two to get “shareholder” access to management – and I don’t think you’re either – if you buy a stock, you believe it will go up.
Rephrased, you buy stocks that you believe are undervalued now, or at least undervalued with respect to your intended holding period.
From that lens, we’re all value investors, making the long-running value-vs.-growth debate somewhat contrived.
But value in a colloquial sense connotes buying a beaten-down, low-expectation stock that you believe the market has excessively punished. It might not be a good company – in fact, it probably isn’t – that you’d sleep well at night holding for the long run. Deep, true value is a valuation play.
Growth connotes the opposite: A company that appears well-appreciated by the market – often far more expensive than the market average on a P/E basis – yet which you believe has an even brighter future than an apparently optimistic market expects. Microsoft (Nasdaq: MSFT) in the 1980s and 1990s as well as Apple (Nasdaq: AAPL) and Google (Nasdaq: GOOG) in the early 2000s took near-constant flak for being overpriced – while rising many thousands of percent in the process.
There are seasons for value and seasons for growth, but academic research hints at more seasons for value.
One study I often mention is Contrarian Investment, Extrapolation, and Risk (Lakonishok, Schleifer, Vishny, 1994), which divided stocks into deciles by both E/P (earnings yield, or the inverse of P/E) and book-to-market (inverse of the P/B ratio). The trio found that the cheapest 10% of stocks by P/E outperformed the most expensive by 4 percentage points per year, and that the cheapest 10% by historical sales growth – the revenue deadbeats – beat the most expensive by 7.3 percentage points yearly.
But when they combined P/E and sales growth, they found the real magic: stocks in the cheapest, slowest-growing decile outperformed those in the highest by 11 percentage points per year.
Combining Factors = Investing Magic?
Speaking of combining factors, James O’Shaughnessy, writing in What Works on Wall Street, also found that low P/E did well – but that value in combination with momentum performed especially well. (“Value” for O’Shaughnessy was not just low P/E but rather a 5-factor composite.)
| Growth of $10,000 from 1964 to 2010 (US) | |
| All stocks | $1,329,513 |
| Large-cap stocks | $872,861 |
| Priciest 10% by P/E | $118,820 |
| Priciest 10% by P/E (large-cap only) | $185,848 |
| Cheapest 10% by P/E | $10,202,345 |
| Top decile by value (5-factor composite) plus top 50 stock by 6-month momentum | $41,411,163 |
| Top decile by value (5-factor composite) plus top 25 stock by 6-month momentum | $69,098,587 |
Data source: What Works on Wall Street/James James O’Shaughnessy
Obviously, from this data, low P/E seems a lot better than high P/E, but the addition of momentum steals the show.
It would seem fair to say that wonderful investing results can potentially be had by combining the right factors. Just remember that every time impressive results get published, money usually flows into those strategies.
My take: Many factors or factor combinations likely work well in certain times or market conditions. Some work until more people find out about them. Only a few work semi-reliably over many decades, and none work perfectly every single time.
If one did, investing wouldn’t be so profitable.
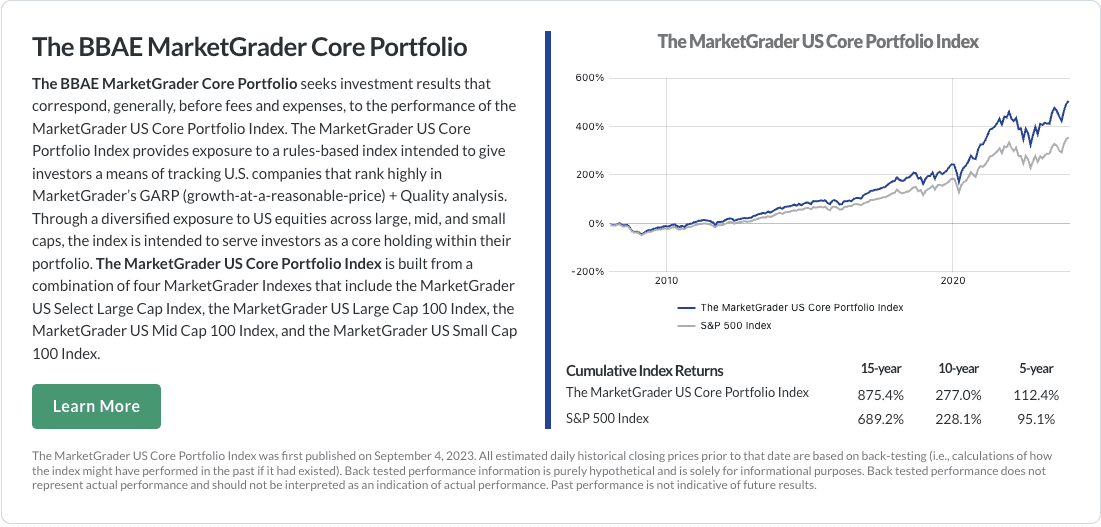
MarketGrader Combines Factors
When BBAE set out to choose a smart beta offering for our account holders, we chose MarketGrader – partly because its founder, Carlos Diez is an incredibly nice guy, but especially because MarketGrader uses a 24-factor model that includes both value and momentum inputs. (As a bonus, Carlos, like me, is of the mind that the value-vs.-growth debate is contrived.)
The MarketGrader managed accounts we offer are exclusive to BBAE, and their multi-factor approach is designed to give them all-weather performance.
Rather than trying to turn $10,000 into $69 million, the MarketGrader portfolios seek to be a better baseline than a standard S&P 500 index fund by delivering incrementally better risk-adjusted returns.
This goal may not sound dramatic, but considering that many, if not most investors have broad-market ETFs as their largest holdings, doing a bit better every year can add up to meaningful wealth over time for most people.
You can see the test results of the Core portfolio below (like most of the data in this article, the results are from testing, and actual future results will vary). BBAE also offers a growth-focused portfolio as well as one focused on growth and income, which we feel has particularly impressive results considering it’s targeting a 5% yield. (Read more about the high-dividend portfolio here.)
Disclaimer: This article is for informational purposes only and is neither investment advice nor a solicitation to buy or sell securities. All investment involves inherent risks, including the total loss of principal, and past performance is not a guarantee of future results. Always conduct thorough research or consult with a financial expert before making any investment decisions. Neither the author nor BBAE has a position in any investment mentioned.