
2024’s Big Secret Buried Inside the Magnificent 8 Stocks
If there was an investment theme of 2023, it might have been AI, or it might have been GLP-1 agonists like Ozempic – or it might have been that eight stocks have been largely responsible for the S&P 500’s near-25% return to date.
The “Magnificent Eight:”
- Nvidia, up 246%
- Meta, up 183%
- Tesla, up 131%
- Amazon, up 77%
- Netflix, up 64%
- Google, up 57%
- Microsoft, up 57%
- Apple, up 53%
Data from Google Finance
This is a story because it’s not usually the case. Charlie Bilello’s chart shows how much weight the top 10 stocks in the S&P 500 have in a market cap-weighted version of the index.
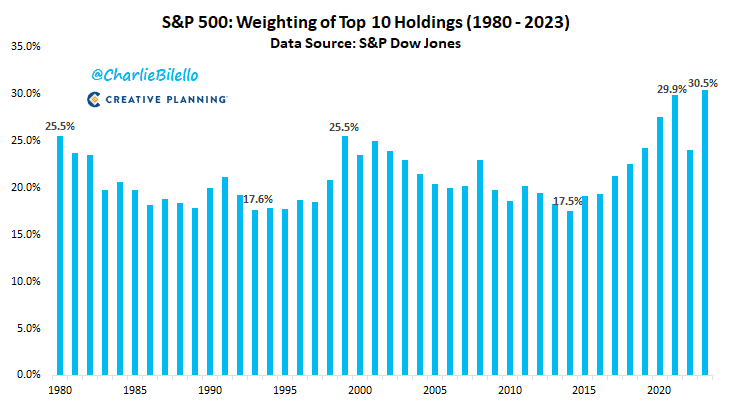
Think about that. Out of roughly 500 stocks (the S&P 500 is reconstituted quarterly and doesn’t strictly hold 500 stocks by the day), the top 10 – and 10 is just 2% of 500 – make up more than 30% of the punching power of the index.
The left side of an index pie chart is almost a little trippy to look at, but that furthers the point, in a way.

If you’ve taken a statistics class – or if you can picture a professional basketball team talking to a preschool classroom – you know that averages and medians don’t necessarily represent all constituents of a population accurately.
This phenomenon is particularly stark if you compare the regular market capitalization-weighted S&P 500 with an equal-weighted version:

The regular S&P 500 did way, way better.
This dominance of mega-cap tech stocks was good for a lot of people, as far more people hold a cap-weighted index fund than an equally weighted one, and evidence has shown that big tech stocks are widely held by retail investors.
Now, the bad news: it doesn’t always work like this – I mean, with large-cap tech stocks delivering the lion’s share of returns.
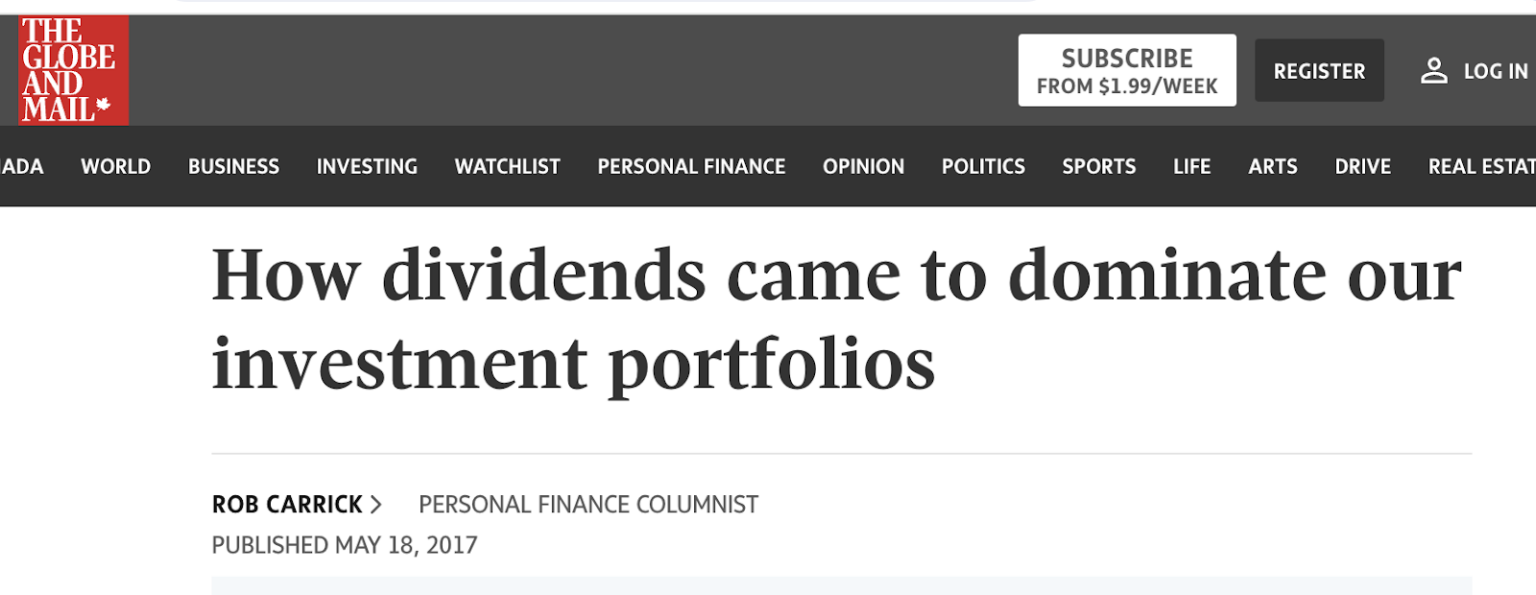
Source: The Globe and Mail
We had a nice run of dividend stocks not long ago, as the Globe and Mail title from 2017 above references.
And don’t forget that following the dot.com crash in 2001, what rebounded the most was small-cap value, as this 2005 New York Times excerpt illustrates.
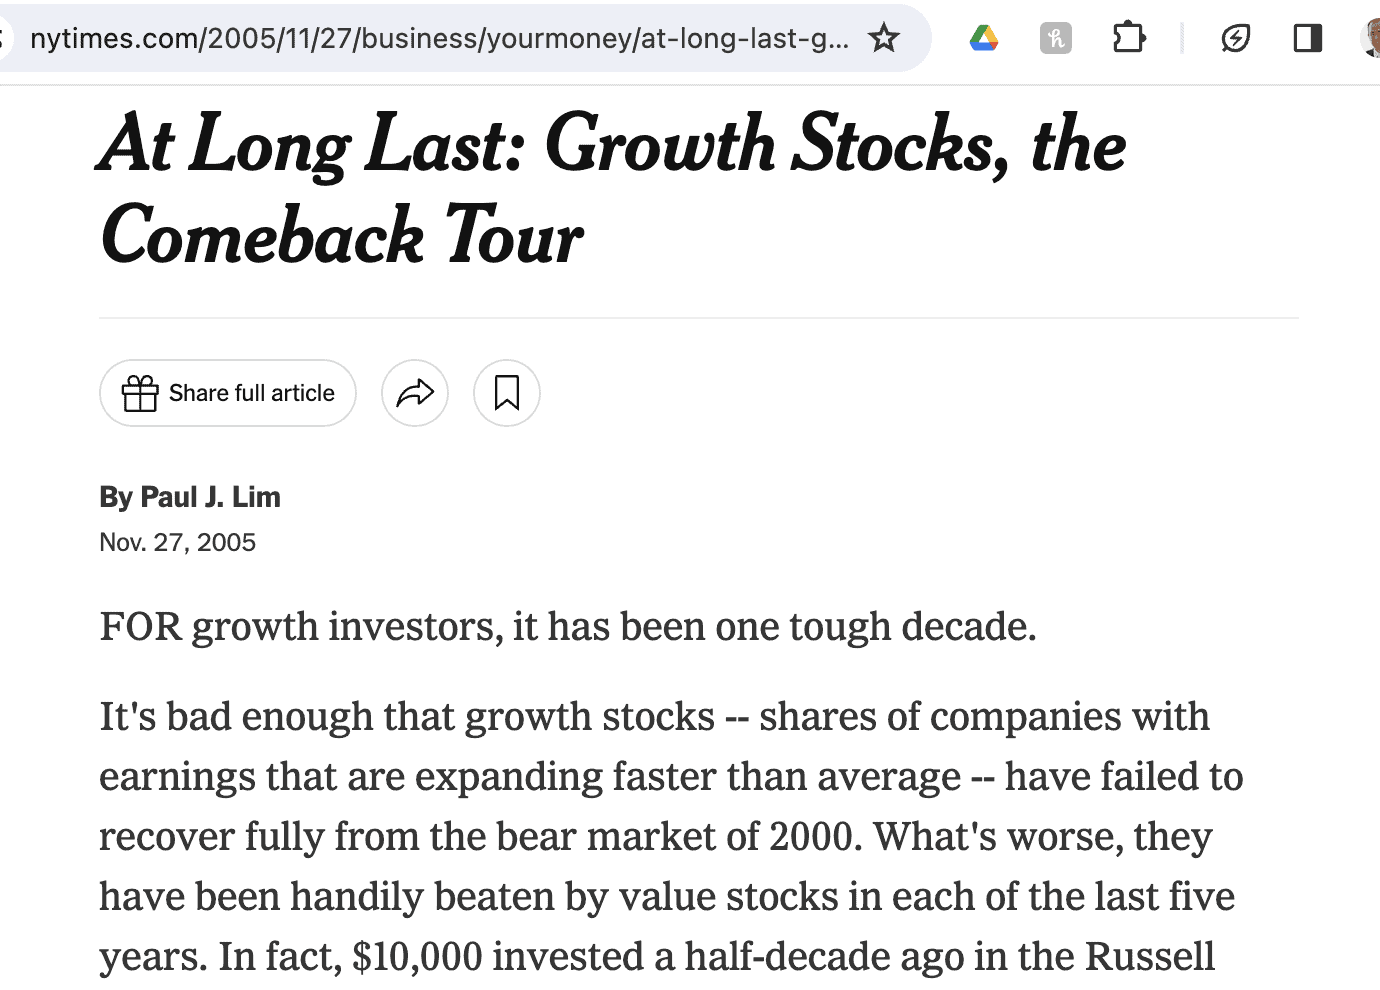
Source: The New York Times
And while I’m citing Charlie Bilello, here’s a chart he showed of small-cap dominance from 2000 all the way until about 2011:
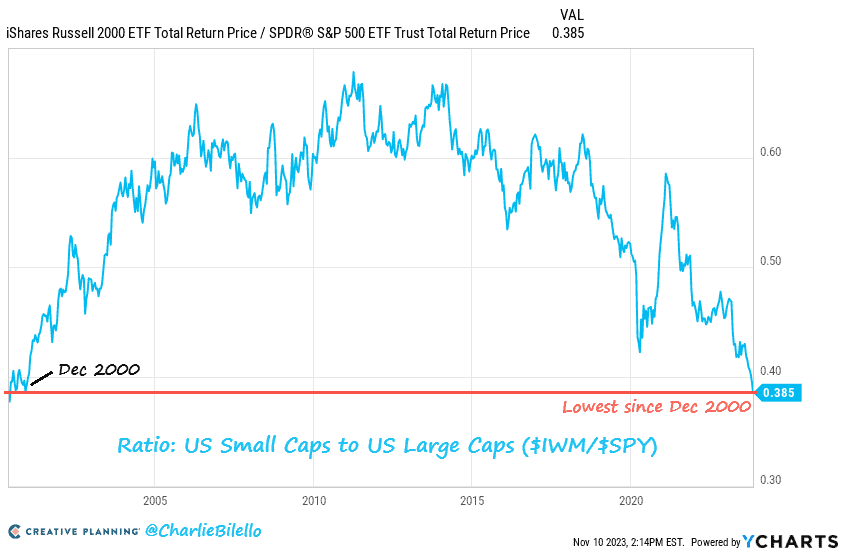
Source: Charlie Bilello
Being in a market dominated by a certain set of factors – whether size (small-cap, large-cap, etc.), dividends, industry, sales growth, valuation (high P/E or low P/E), or anything else – is like being in the middle of a fashion trend. In the moment, it’s hard to imagine you ever sported anything other than what’s currently the rage. But then one day you look back at old photos of your [insert: mall-queen bangs, mullet, parachute pants, bell bottoms, etc.] and laugh. Maybe you cringe a little, too.
It’s the same with investing.
When you’re in the middle of one set of factors dominating, it’s hard to imagine anything else dominating – but different factors always come around, or at least always have.
So while a market-cap weighted index was absolutely, positively the best place to be in 2023 – form an overall-market (“beta” in academic parlance) sense, at least – it won’t always be. In fact, some analysts might make a case that things are primed for a reversion, after so much big tech dominance.
So what do you do?
Option 1: Bet on the next set of up-and-coming factors. For instance, if large-cap growth stocks have been dominating, someone might bet on a turning of the tables in favor of the opposite: small-cap value.
Option 2: Rather than overweight any one or two factors, find a basket of factors that have individually worked over time. Find the market’s blue jeans, in other words – something that tends to have persistence in style.
This is what we found when we stumbled across a company called MarketGrader.
MarketGrader – as you may know if you’ve seen our content about our recent partnership – is a “smart beta” research firm that creates indices based on factors other than market cap. Now, you didn’t particularly need this in 2023 – market cap was a favored factor as we just discussed – but also as we just discussed, in many other years, market cap wasn’t as “in” – something else was.
MarketGrader uses a matrix of 24 different factors – mostly fundamental-leaning – to sort stocks by attractiveness. And over the past 10+ years, a full 47 out of the 52 indexes it’s created have beaten their benchmarks.
For BBAE, MarketGrader created three custom indexes, all of which have performed fantastically well on 15-year backtests, and all of which you can read more about here.
This article is for informational purposes only and is neither investment advice nor a solicitation to buy or sell securities. Investing carries inherent risks. Always conduct thorough research or consult with a financial expert before making any investment decisions. James owns shares of Apple, Amazon, Netflix, and Meta. BBAE has no position in any investment mentioned.