
Once upon a time, the primary financial purpose of a company was to make a profit for its investors.
Then came securitization. Then came more investors, and with them, Greater Fool Theory.
Then came tech firms willing to lose money to capture market share in exchange for potential parabolic payoffs. Metrics designed for “linear,” old economy firms don’t fit these new firms, at least during their money-losing phases.
Today’s markets still mostly house traditional companies, but have grown tolerant of lose-now–hopefully-win-later firms – and the most successful of them have actually won, and pretty well.
In other words, whether investors give them a long leash or a short leash, companies must eventually add economic value.
What is ROIC?
There is no better measure of whether or not a business is adding true economic value than return on invested capital, or ROIC – or, technically, comparing ROIC to a company’s weighted average cost of capital (WACC). I’ll cover both today.
Simply put, high ROIC stocks have been shown to perform better than others, as this Morgan Stanley graphic illustrates.
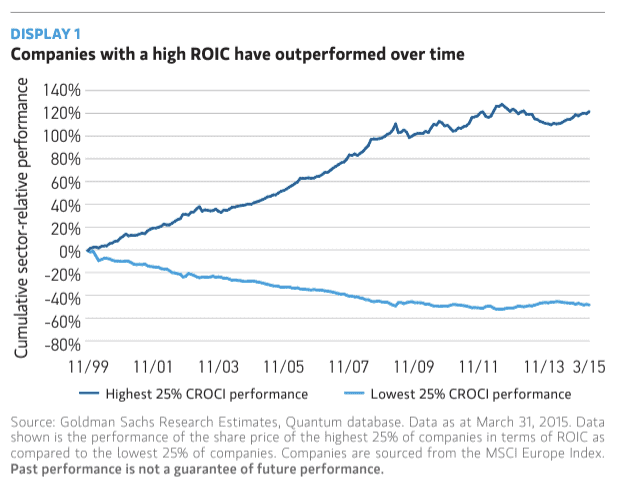
Source: Morgan Stanley
If you’ve heard of return on equity (ROE) – one of Warren Buffett’s favorite metrics – then you’re halfway to understanding ROIC.
Whereas ROE compares the return to equity investors to the capital (conceptually) provided by equity investors, ROIC compares the return to both debt and equity investors to the capital provided by both.
ROIC: The Numerator
The “return” part for ROE is easy – it’s just net income, which is whatever money remains after a company’s operating costs, interest expenses, and taxes have been paid.
For ROIC, we must adjust for a hiccup that financial reporting gives us.
The ROIC numerator is the share of a company’s proceeds available to (1) debt providers and (2) equity providers.
The closest thing we have on the income statement is operating income, which is the share of a company’s proceeds available to (1) debt providers, (2) the tax authorities, and (3) equity providers.
We don’t want the tax part. We want an after-tax operating income, because that would represent proceeds available to debt and equity investors only.
Because we don’t have it on the financial statements, we have to make it by multiplying operating income (or EBIT, aka earnings before interest and taxes, which is substantially similar to operating income although as a non-GAAP metric it sometimes excludes non-recurring expenses) by (1 – effective tax rate).
The effective tax rate, if you’re wondering, is simply the income taxes paid (or, more confusingly, claimed to have been paid, as cash taxes actually paid vary in many countries, including the US) divided by pretax income.
The fruit of our effort is a numerator called net operating profit after tax, or NOPAT.
So if your operating income is $100 and your effective tax rate is 35%, your NOPAT is $65.
ROIC: The Denominator
So if the “return” part of return on invested capital is tax-adjusted operating income (NOPAT), what’s invested capital?
The simplest formula is: debt + equity.
This is entirely legit.
If you prefer a more complicated perspective, the ROIC denominator could be thought of as anything a company could be expected to earn a return (through its operations) for its investors on.
Just the return-earning assets, then, and just the operational ones.
By “operational” I mean we exclude cash, under the simplifying assumption that a company can easily park its excess cash in a money market fund and thereby do right by investors on the cash portion of its business.
A more nuanced perspective would be that some baseline amount of cash actually is an operating asset in that a company couldn’t operate without it, and that that cash – perhaps a certain small percentage of sales, with the percentage varying by industry or business model – should be kept in the denominator while “excess” cash can be factored out.
This path would start with total assets, and then subtract out either excess cash or all cash, and then any “free” liabilities on which no return is expected – non-interest bearing liabilities (NIBLs)* in accounting parlance. Current portions of long-term debt**, which will be paid off before they accrue further interest, could be subtracted, too.
In other words, to the extent a company can stall in paying its vendors or stall in paying the taxman, or stall in paying its employees (I’m not commenting on the ethics of stalling, which may be perfectly acceptable business practice in some settings and usurious in others), it gets to offset its total return-expecting assets by that amount.
Pretending your total assets are $1,000 and you’ve got $20 worth of accounts payable, $20 in taxes payable, and $20 in accrued wages, your invested capital would be $940.
*For the hair-splitters, note that you’ll usually see this billed as non-interest bearing current liabilities, or NIBCLs. In theory, any liability, current or non-current, on which interest does not accrue could be thought of as free financing, so I remove the “C” from my acronym, although in a working sense, we don’t live in a world in which free financing is likely to exist beyond a few months, so nearly all NIBLs will be NIBCLs in real life.
**Speaking of debt, some people subtract zero-coupon debt from invested capital, apparently reasoning that because no yearly cash interest is paid, it’s “free” financing. I respectfully disagree with this position on the grounds that an implied yearly return is baked into zero-coupon pricing. There may be no year-to-year cash interest, but it is certainly not free financing.
Common ROIC Denominator Adjustments
It probably feels like we’re in the weeds already – and you can probably see why ROE, ROIC’s far simpler cousin, likely gets used 100 times more frequently than ROIC. ROIC takes legwork, even if proponents would say it’s justified.
And I’m giving you one of the simpler versions in this article.
But staying near to the basics, below are some common balance sheet adjustments:
| ROIC Common Invested Capital Adjustments | ||
| Item | Logic for adjusting | Adjustment |
| Cash | Excess cash is not an operational asset and is typically invested in a low-risk account earning a fair return for risk taken, so excess cash is not an operating asset and should be excluded from the ROIC denominator. | After you define excess cash (for example, any amount over a few percent of sales), remove it from the denominator. |
| Research and development (R&D) expenses | Accountants force these to be expensed owing to their uncertainty of realizing benefit, but R&D (and, occasionally, advertising) may essentially create off-balance-sheet value that should be factored into a company’s capital. | Whereas adjustments for cash are very common, and adjustments for operating leases somewhat common, ROIC adjustments for R&D are less common. They are rare for advertising, but both R&D and advertising would be adjusted in a similar manner as operating leases. |
| Advertising expenses | ||
| Goodwill | Acquisitions are business investments, but if a company clearly overpays for a single acquisition, holding that overpayment over its head forever by keeping a large block of goodwill in capital may cloud the analysis of operational profitability apart from the one-time overpayment. Conversely, serial acquirers whose goodwill arose from habitual acquisitions may not merit goodwill removal. | Remove goodwill from capital if adjustment is deemed worthy. |
ROIC: An Example
For the past 20 years, I’ve been using WD-40 as my go-to for financial statement explanations because this company has some of the clearest financial statements I’ve ever seen. I have no relationship with the company; I just find their reporting easy to use for demonstrating, and see no reason to stop now. (Guys, if you’re reading this, know that your work has fallen on fertile, appreciative soil.)
Anyway, have a look at their income statement. (Both income statement and balance sheet below are sourced from the 10-K inside WD-40’s 2023 Annual Report.)
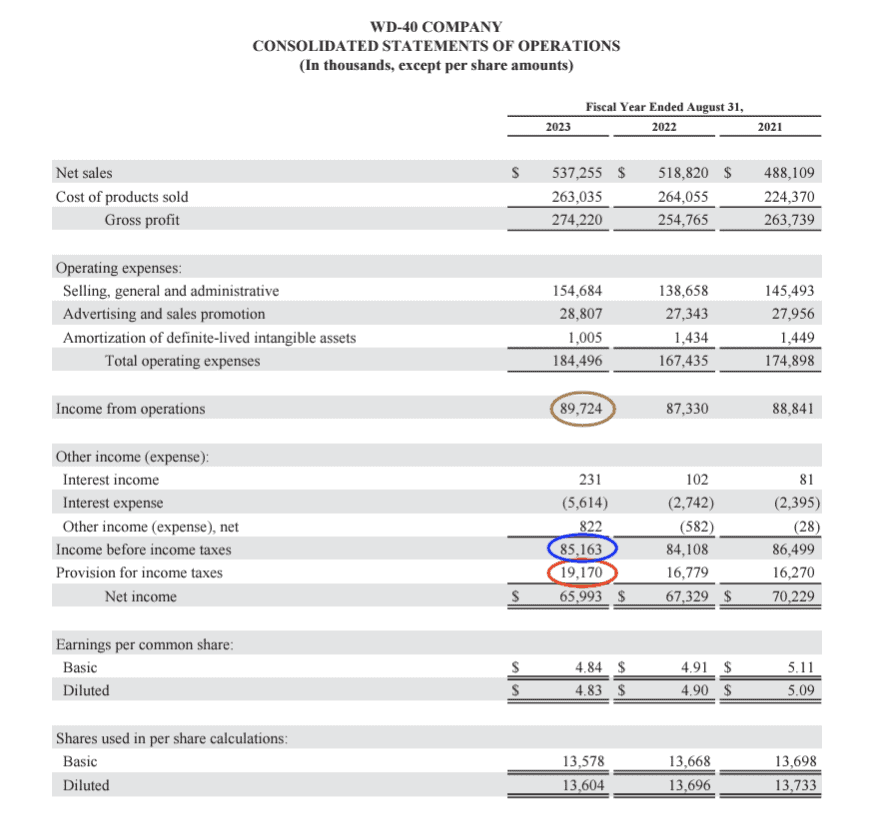
The most important number for NOPAT is the operating income (brown oval) of $89,724,000.
But remember: We need to multiply it by (1 – effective tax rate).
The effective tax rate is income tax expense (red oval) of $19,170,000 divided by pre-tax income (blue oval) of $85,163,000.
WD-40’s effective tax rate is 22.5%
So WD-40’s NOPAT will be:
$89.724 million x (1 – 0.225) = $69,536,100
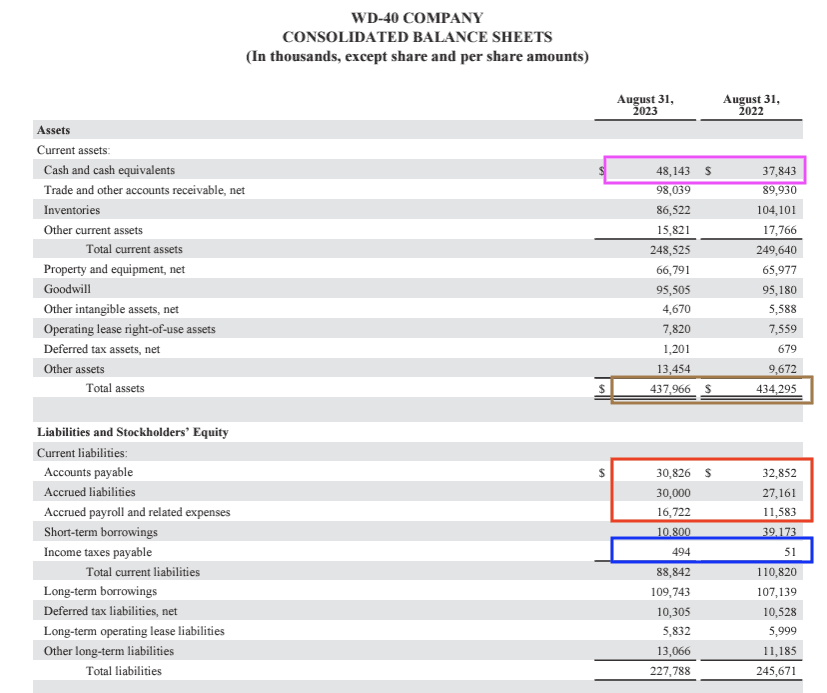
I’m highlighting two periods for the denominator calculation, with the logic that because WD-40 earned its NOPAT over the course of a year, it’s logically consistent to compare NOPAT to the assets WD-40 employed over the course of a year, instead of just a year-end snapshot. We don’t have daily or hourly balance sheet numbers, so using quarterly averages would be the gold standard in countries where companies report quarterly, but we’ll go with the silver standard of beginning and ending values (a two-period average) for ease of computation.
Start with total assets (brown highlight), which average to $436,130,500.
Now, we subtract/ We could rip out all the cash, but for sake of demonstration, let’s pretend that WD-40 needs 1% of sales in cash as an operating asset. The rest is surplus. Sales for 2023 were $537,255,000, and 1% of that is $5,372,550, which we can round to $5 million.
Average cash balance is $42,993,000, so yanking out $5 million – a guess for demonstration at this point; we’d need further working capital analysis and perhaps a call to the company to get more precise – gives us $37,993,000 in excess cash.
Now for the NIBLs/NIBCLs. All the current liabilities are clearly NIBLs, perhaps save for short-term borrowings, so I excluded that. Collectively, they average $74,844,500.
So:
$436,130,500 in assets
– 37,993,000 in excess cash
– 74,844,500 in NIBLs
—————————-
$323,293,000
WD-40’s invested capital is $323,293,000.
WD-40’s ROIC for 2023, therefore, is:
$69,536,100 ÷ 323,293,000 = 21.5%
I can tell you that this is an excellent number.
But how excellent?
You Just Calculated ROIC: WACC is Next
Pretend you borrow money from the bank at 7% interest to invest in stocks (you probably shouldn’t, by the way). You’d better earn at least 7% return, right?
Same for running a business.
Your capital providers aren’t giving you money for free.
Debt costs are easy, Debt has a contractually stipulated return. Interest expense comes before pre-tax income on the income statement, meaning interest expense is tax-deductible, so if a company’s debt is at 10% and it pays a 30% effective tax rate, its after-tax cost of debt is 7%.
Equity costs are mushier. Equity is a riskier, and residual, claim, so stockholders expect higher returns than bondholders.
But how much more is correct? Nobody really knows, despite years of academic efforts.
We do know the risk-free interest rate (10-year US Treasuries are most commonly used for long-term equity investors, because 10 years loosely approximates a long-term equity holding period).
We do know that over time the S&P 500 has delivered about 10% yearly in nominal terms (7.5% to 8% in real, or after-inflation, terms).
So we can say that investors might expect a 10% annual return from an S&P 500-ish type of stock, based on a fairly long historical precedent.
We can also subtract the risk-free rate from the equity return and declare that a current “risk premium” that investors need to entice them away from sleepy Treasuries and into an S&P 500 ETF.
But beyond that, we don’t really know. Practically, public equity cost estimates may vary from 6% for a safe utility stock in a low-interest rate environment* to, say, 15% for a risky biotech in a period of higher rates.
* Whether and how much to adjust expected capital costs for interest rates is a contentious topic. I personally prefer using a long-term normalized rate to adjusting, as adjusting is essentially making a bet on interest rate movement, which is hard and likely adds inaccuracy to an analysis.
The Capital Asset Pricing Model (CAPM) is the most famous attempt to divine an equity cost using past price movement. Specifically, it multiplies the risk-free rate by the product of the market risk premium (discussed above) and a “beta” coefficient that represents a stock’s co-movement against the market. (The market has a beta of 1 by definition, and a stock with a beta of 2 would be twice as “volatile,” yet volatile in generally the same direction of the market, whereas a stock with a beta of -0.5 would be half as volatile and inversely so at that.)
CAPM is an elegant construct, yet its empirical support in the literature is dubious.
My own rule of thumb is to start with 10% for a middle-of-the-road stock and eyeball it up or down a few points depending on my subjective estimation of relative risk.
So to get WACC, you first get debt costs – ideally standardized to what it would cost on 10-year terms; don’t be swayed by companies taking out very short-term financing for very low rates – adjust them for taxes, then use whatever divination you prefer to get equity costs, and then you weight them proportionately.
If after-tax debt costs are 7% and equity costs are 10% and a company uses 50% debt and 50% equity financing (at market values), its WACC would be 8.5%.
WD-40’s WACC?
We’ll make this very back-of-the envelope, as I’m certain that WD-40’s 22.5% ROIC is adding economic value (an ROIC above a WACC indicates economic value added).
WD-40’s market cap is $3.4 billion and the book value of its debt is about $140 million. Technically, we want market values for debt, and there are ways to estimate it (and some online calculators), but at book values, debt financing is just below 4% of total capital at book values, so it’s not going to be a big needle mover.
I’d guesstimate a 9%-10% cost of equity for WD-40. This is my number, and some will disagree, and that’s why we have a market. But let’s say 10% for easy math.
WD-40’s 2023 interest expense was $5,614,000. So it’s paying about 4% on its debt.
After tax, that’s 3.1%.
So 96% x 10% = 9.6% equity weight in WACC
And 4% x 4% = 0.16% debt weight in WACC
Total WACC would be 9.716%.
Yes, this was quick and rough, but WD-40’s 22.5% ROIC is high enough that we don’t need to split hairs on the WACC in my view.
As you can see ROIC requires some accounting and finance knowledge. The good part? The price of entry keeps newbies and rubes at bay, potentially leading to better returns for investors with the knowledge and patience to use ROIC properly.
This article is for informational purposes only and is neither investment advice nor a solicitation to buy or sell securities. All investment involves inherent risks, including the total loss of principal, and past performance is not a guarantee of future results. Always conduct thorough research or consult with a financial expert before making any investment decisions. Neither the author nor BBAE has a position in any investment mentioned.